
In this guide
An equation appears, the clock is running, and the calculator is one click away. The useful question is not whether Desmos can do something with the equation. It is whether a graph, a calculation, a table, or a few lines of algebra will get you to the requested answer clearly and reliably. Good calculator use begins with that choice.
Bluebook includes Desmos graphing and scientific calculators, and students can switch between them during the Math section. A permitted handheld calculator is another option. The current policy prohibits calculators with computer algebra system, or CAS, functionality and requires removal of stored documents and programs with algebra functionality. These rules were checked on September 17, 2026; read the current policy before your test. [1]
This guide develops a small set of dependable habits. Every worked problem below is an original editorial example, not an official SAT question. Practice the method, the interpretation, and the check together. A calculator result is useful only when you know which question it answers.
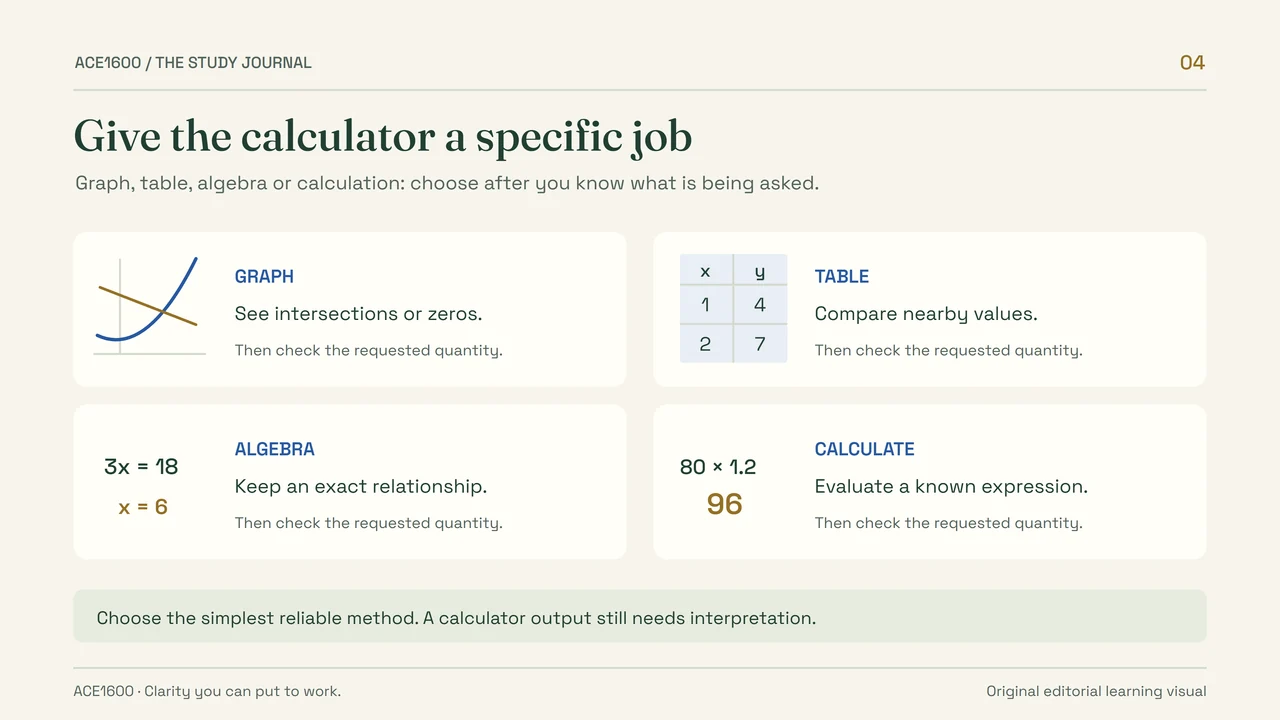
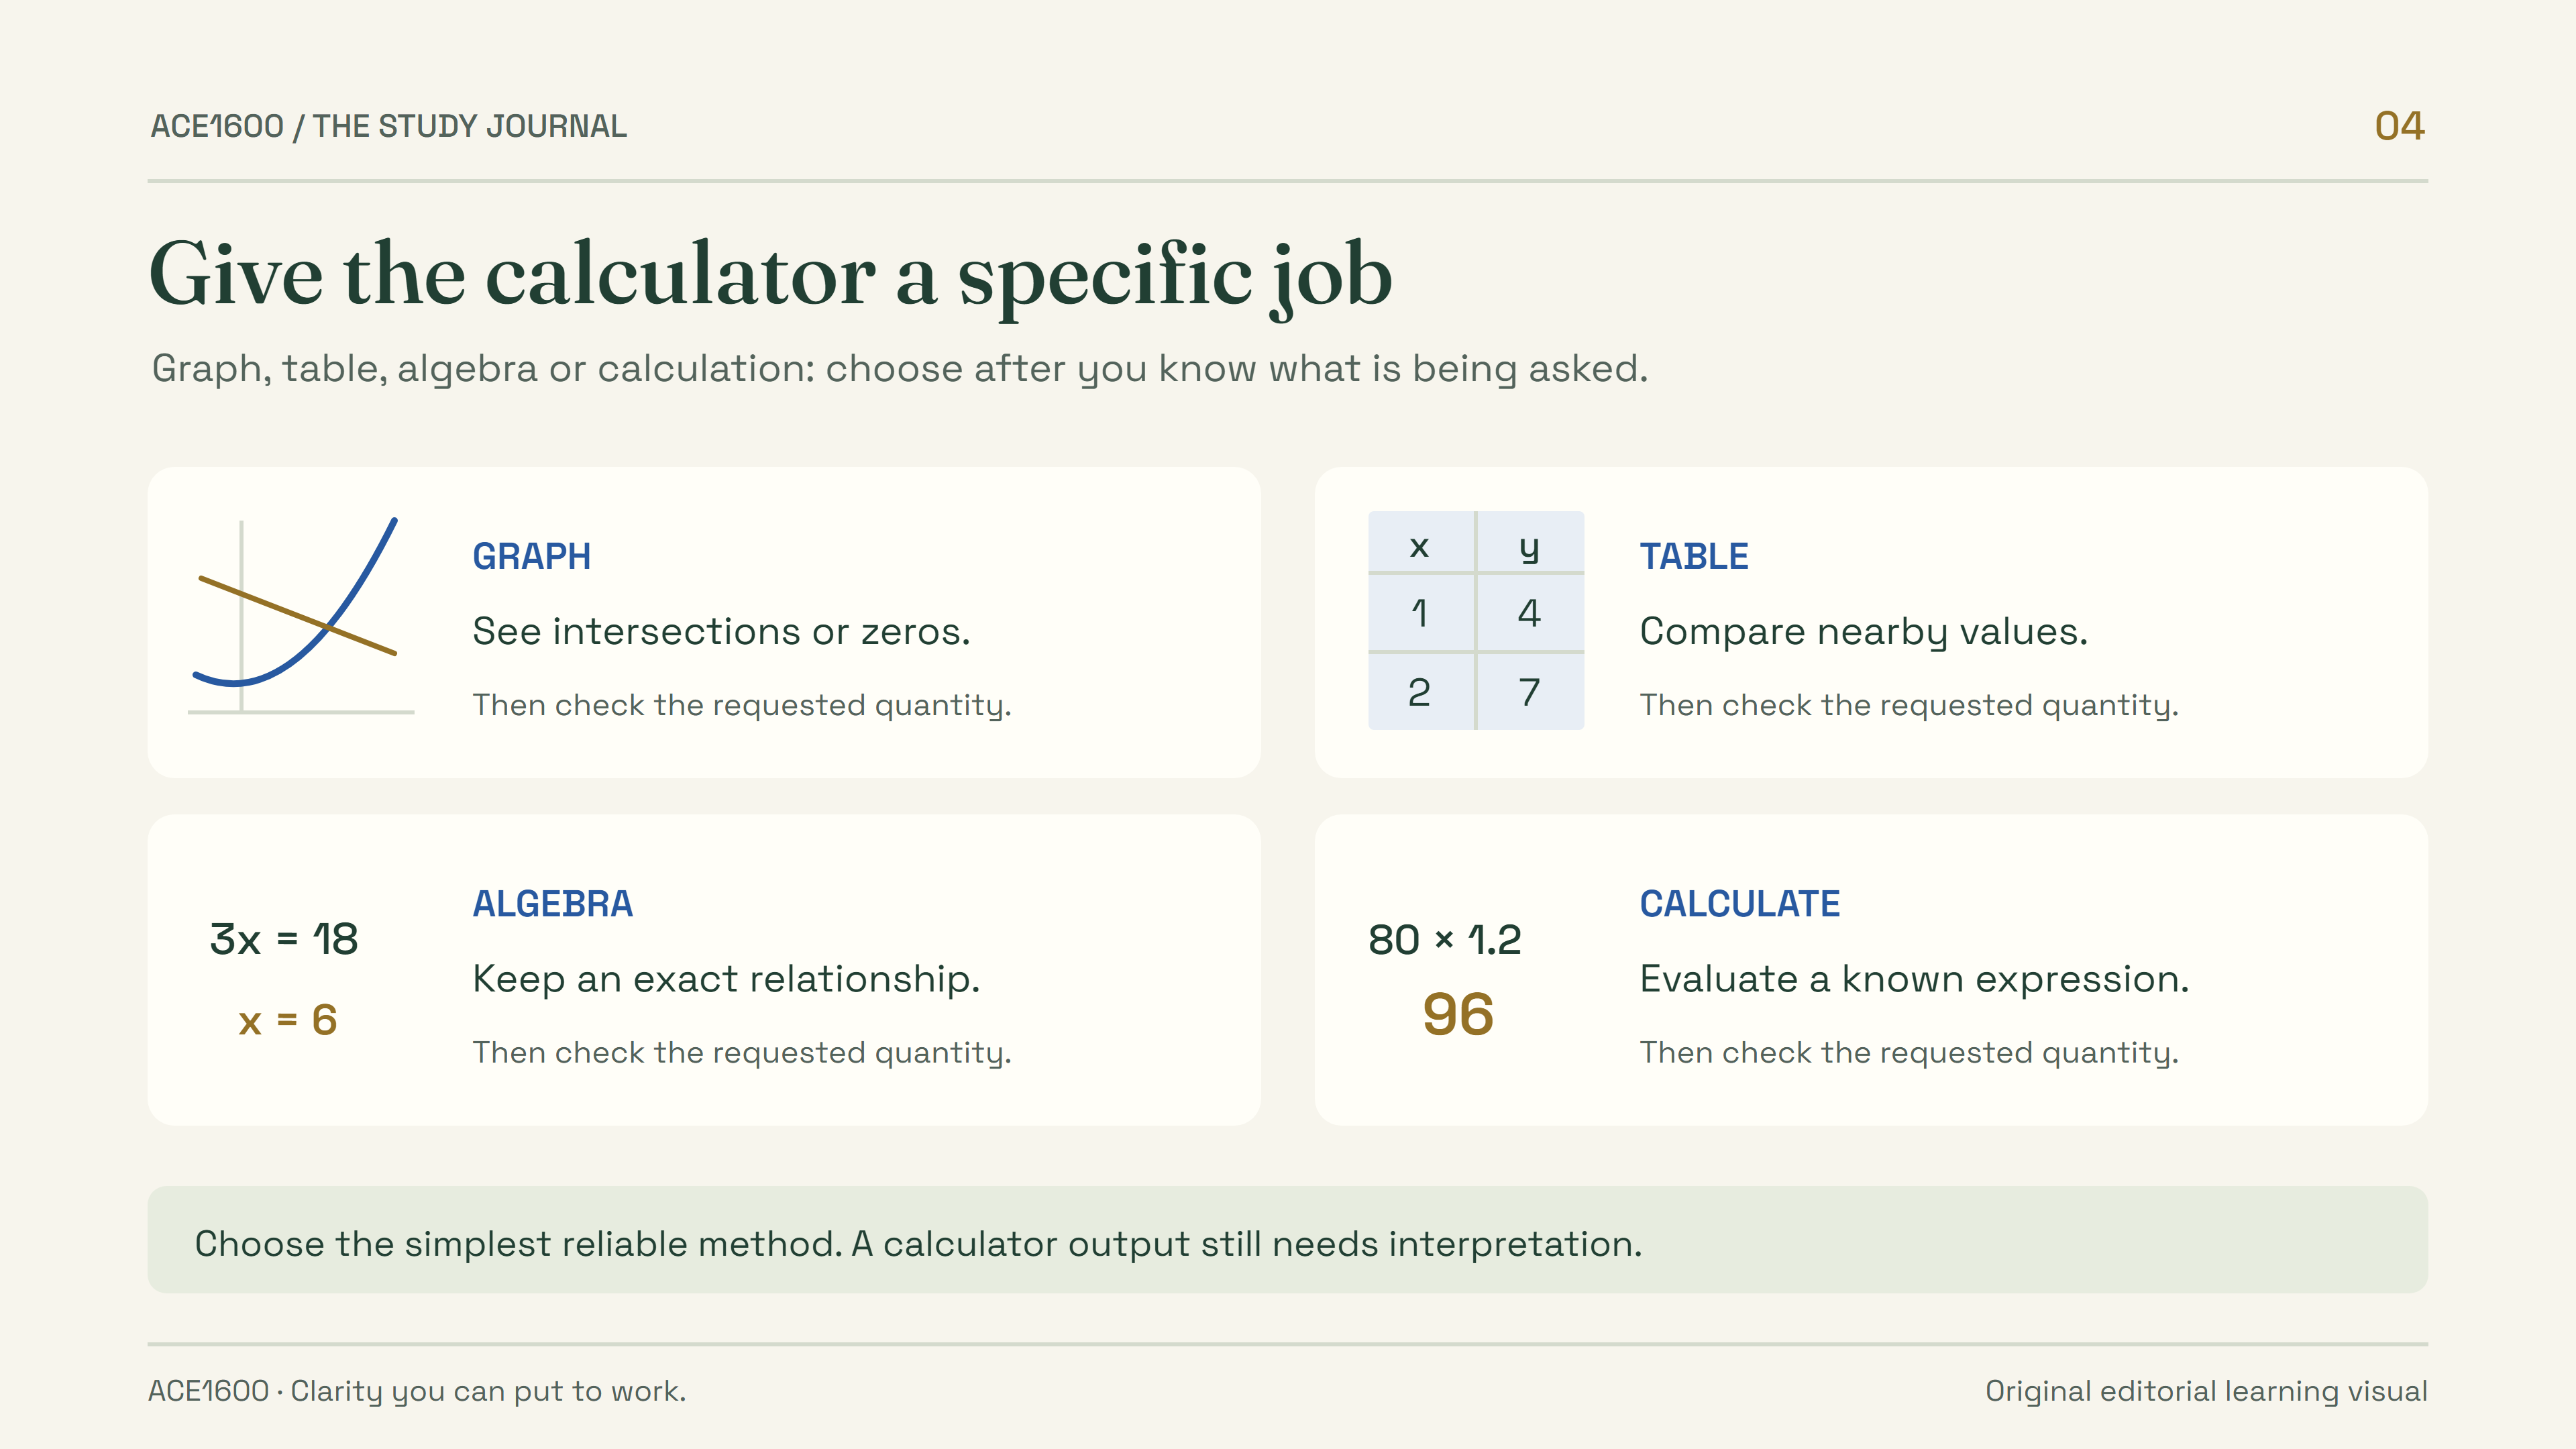
Read the visual as text
- Use a graph to inspect intersections or zeros.
- Use a table to compare nearby values.
- Use algebra to preserve an exact relationship; 3x = 18 gives x = 6.
- Use calculation to evaluate a known expression; 80 × 1.2 = 96.
- Check that the result answers the requested quantity.
1. Give the calculator a specific job
The SAT Math section spans linear relationships, nonlinear expressions and functions, data analysis, geometry, and trigonometry. Its questions include both multiple-choice items and responses you enter yourself. That range makes a single rule such as “graph every question” a poor preparation strategy. Different problems reward different representations. [2]
Before touching a tool, say what you need: a solution, an intersection, a maximum, a rate, an equivalent expression, or a value at a particular input. Then ask what would count as evidence. If the problem asks which expression is equivalent for every permissible value of x, checking one input is not sufficient. If it asks when two prices match, an intersection may be exactly the evidence you need.
A short decision before you calculate
- Identify
Name the unknown and the quantity the question asks for.
- Choose
Use algebra, arithmetic, a graph, or a table that exposes that quantity.
- Interpret
Check the coordinate, unit, and allowed values.
- Verify
Substitute or estimate before entering the answer.
Use arithmetic for a direct percentage or substitution when the inputs are already known. Use a graph to inspect roots, intersections, or function behavior. Use a table to compare selected inputs. Keep algebra available when an exact value, a parameter, or a structural relationship matters. You are building flexibility, not loyalty to one method.
2. Use intersections when two quantities must match
An intersection represents an input-output pair that satisfies two relationships at once. That is why graphing can be useful for systems of equations and comparison problems. Write both relationships with the same variable meanings first. Two lines on one screen are not automatically describing comparable quantities.
Original editorial example: two delivery plans
Plan A charges a fixed $12 plus $3 per delivery. Plan B charges $5 per delivery with no fixed charge. Let n represent the number of deliveries and C the total cost in dollars. The equations are C = 12 + 3n and C = 5n.
To graph them, use x for deliveries and y for dollars: y = 12 + 3x and y = 5x. Their intersection is (6, 30). The plans therefore cost the same at 6 deliveries, and that shared cost is $30.
Check without the graph: 12 + 3(6) = 30 and 5(6) = 30. If the question asks for the number of deliveries, enter 6; if it asks for the shared cost, enter 30. Both numbers appear on the screen, but only one answers each question.
This example also shows when the calculator may be unnecessary. Solving 12 + 3n = 5n gives 12 = 2n, then n = 6. Those steps are short. Graphing becomes more attractive when the expressions are less convenient or when a picture helps you understand which plan becomes cheaper.
Notice the contextual restriction. Deliveries are whole numbers at least zero. A different pair of plans could intersect at 6.4 deliveries. That coordinate would still describe the mathematical lines, but a question about whole deliveries would require interpretation. Do not round an intersection automatically; read whether the question asks for equality, the first cheaper option, or a minimum count.
3. Distinguish a root from a maximum
A root tells you where a function's output is zero. A vertex on a parabola identifies its turning point. These features answer different questions, and confusing them is more common than a difficult calculation. Label the axes before you inspect the graph, especially when the variables represent time, distance, revenue, or height.
Original editorial example: height above the ground
A ball's height is modeled by h(t) = −5t² + 20t + 25, where height is measured in meters and t is seconds after release. Under this model, when does the ball reach the ground?
Graph y = −5x² + 20x + 25. The horizontal-axis crossings are x = −1 and x = 5. Because the question concerns time after release, the valid answer is 5 seconds. The negative root belongs to the extended mathematical model, not the requested interval.
The vertex is (2, 45). It answers a different question: the greatest height is 45 meters, reached 2 seconds after release. Check h(2) = −20 + 40 + 25 = 45 and h(5) = −125 + 100 + 25 = 0.
The same graph, three different questions
- Starting height25 meters
Use the output at t = 0.
- Greatest height45 meters
Use the vertex output, reached at t = 2.
- Ground contact5 seconds
Use the nonnegative time where height is zero.
A graph window can hide the feature you need. Before concluding that there is no crossing, consider the scale and expected input range. A small window around the origin may not show a distant intercept; a very large window may conceal a narrow feature. Change the view for a reason rather than repeatedly zooming and hoping.
You can also solve the example by factoring: h(t) = −5(t − 5)(t + 1). This produces the same roots and makes the exact values clear. Moving between a graph and algebra strengthens the check. It does not mean every solution needs two full methods; a brief substitution is often enough.
4. Use tables to test a model, not to invent certainty
A table is helpful when you need outputs at selected inputs, want to compare a formula against given data, or need to see whether a proposed answer behaves plausibly. It keeps individual values visible and can be easier to read than a crowded graph. It cannot, by itself, prove every claim about a function.
Original editorial example: a membership fee
A club charges an $18 joining fee and $6 for each workshop. The model is C(n) = 18 + 6n. At n = 0, 3, and 5, the costs are $18, $36, and $48. A table makes the starting charge and the repeated increase easy to inspect.
If a member pays $54 in total, solve 18 + 6n = 54. Subtracting 18 leaves 36, so n = 6. Check the row for n = 6: the model gives $54. Dividing 54 by 6 would incorrectly count the joining fee as workshop spending.
When a question supplies an exact mathematical relationship, use that relationship. When it supplies measured data and asks about a model, remember that data can involve variation. A line that fits a set of observations describes the chosen model; it does not establish a cause or guarantee future outcomes.
Testing a proposed expression at two or three inputs can expose a mistake quickly. However, expressions can agree at selected inputs and differ elsewhere. Use algebra to establish an identity, or follow the exact task if it asks only for one value. Keep the conclusion as narrow as the evidence.
5. Expect more than one valid mathematical solution
Two nonlinear relationships can meet more than once. Find all relevant intersections, then apply any restrictions in the question. If you inspect only the first visible point, you may solve part of the system and still miss the answer.
Original editorial example: a line and a parabola
Consider y = x² − 4 and y = 2x + 4. Setting the expressions equal gives x² − 2x − 8 = 0, which factors as (x − 4)(x + 2) = 0. The x-values are 4 and −2.
At x = 4, both expressions give y = 12. At x = −2, both give y = 0. The intersections are therefore (4, 12) and (−2, 0). A graph should show both if the viewing window includes them.
If the question asks for the positive x-coordinate, the answer is 4. If it asks for the sum of the x-coordinates, the answer is 2. If it asks how many real solutions the system has, the answer is 2. Read the final sentence again before entering anything.
This checking habit also helps with solutions produced after squaring or clearing denominators. A transformed equation may have candidates that do not satisfy the original restrictions. Substitute into the original relationship, not only your rewritten version. A denominator of zero remains prohibited even if a later line of your work has hidden it.
6. Keep algebra for questions about structure
Some questions concern an unknown coefficient rather than a single numerical solution. Graphing a few choices can help you explore, but a picture alone may not establish the exact parameter. Learn what mathematical condition represents the situation, then use the calculator to inspect or check it.
Original editorial example: exactly one real root
For what value of k does x² − 6x + k = 0 have exactly one real solution? Complete the square: x² − 6x + k = (x − 3)² + k − 9.
The parabola has its minimum at x = 3. It touches the horizontal axis exactly once when its minimum output is zero, so k − 9 = 0 and k = 9. The equation becomes (x − 3)² = 0.
Graphs with k below 9 cross twice; graphs with k above 9 do not cross the horizontal axis. That comparison illustrates the result. The completed-square form establishes the exact value without relying on how close a curve looks to an axis.
Similar reasoning applies to equivalent expressions, transformations, and coefficient relationships. A numerical answer can be useful while still failing to explain why it works. During practice, write one sentence connecting the condition to the method. That sentence is often what lets you recognize a different-looking problem later.
7. Make input and output checks routine
Calculator mistakes often begin before calculation: a missing parenthesis, a negative sign placed incorrectly, or a value entered with the wrong unit. Slow down at the point where words become symbols. That short pause can save a much longer search for an apparently mysterious result.
Three checks after a calculator result
- SyntaxInput
Confirm parentheses, exponents, fractions, and negative signs.
- MeaningOutput
Identify which coordinate or quantity the problem requests.
- ScaleReasonableness
Check units, sign, and an approximate expected size.
For example, 3/(2x) and (3/2)x describe different expressions. At x = 2, the first equals 0.75 and the second equals 3. Likewise, (−3)² equals 9 while −3² conventionally means −9. Parentheses record the relationship you intend; they are not decorative.
Avoid rounding intermediate values unnecessarily. If you calculate a unit price, then multiply by a large quantity, early rounding can change the final result. Keep the stored value when possible and round only as the question requests. If an answer is exact, preserve a fraction or exact expression in your written reasoning even when the display also offers a decimal.
Do not interpret every unfamiliar decimal as evidence that your method failed. Some answers are nonintegers. Instead, ask whether the sign, size, and unit fit the problem. Then check by substitution or estimation. A result of 0.6 hours is 36 minutes, not 60 minutes; the decimal represents part of an hour.
8. Rehearse a small toolkit in the actual testing app
Use Bluebook's test preview to learn the controls and full-length practice to combine tool use with timing. The preview is untimed and does not give score feedback; full-length practice tests are scored. Review results in My Practice and choose targeted questions afterward. Practicing a feature in a different calculator interface does not establish how it behaves in Bluebook. [3]
Learn a manageable sequence: enter an expression accurately, graph a function, inspect an intersection, compare selected values, and clear work before the next unrelated problem. Also become comfortable with the timer, answer elimination, and marking questions for review. These testing tools are available inside Bluebook; familiarity reduces the number of interface decisions you need to make while solving. [4]
For each practice problem, record whether your first method was effective. “Graph worked, but I read the y-value” points to interpretation. “Entered the function incorrectly” points to input habits. “Spent two minutes graphing a one-step equation” points to method selection. Those diagnoses lead to different next steps; simply doing more calculator questions may repeat the same error.
Finish with a mixed set where you decide freely whether to use a tool. Include problems that are quicker by hand and problems where a graph clarifies the relationship. The objective is an answer you can justify within the available time. Calculator fluency supports that objective, but it does not replace understanding the mathematics or checking the current testing rules.
Sources & further reading
Rules and policies were checked on September 17, 2026. Follow the linked official pages for changes. Study plans and worked examples are A1600 editorial guidance.