
In this guide
A percentage is a comparison. The number beside the percent sign matters, but the quantity being used as the base matters just as much. Many apparently tricky questions become straightforward once you identify what represents the whole and whether that whole changes.
College Board’s Problem-Solving and Data Analysis domain includes percentages, ratios, data, probability, and the interpretation of statistical claims. [1] These topics share a habit of mind: define the comparison before calculating. A correct arithmetic operation can still answer the wrong question if it uses the wrong denominator.
The examples in this guide are original teaching problems. They move from simple changes to tables and evidence, showing how to keep the meaning of a calculation visible throughout the work.
Read the visual as text
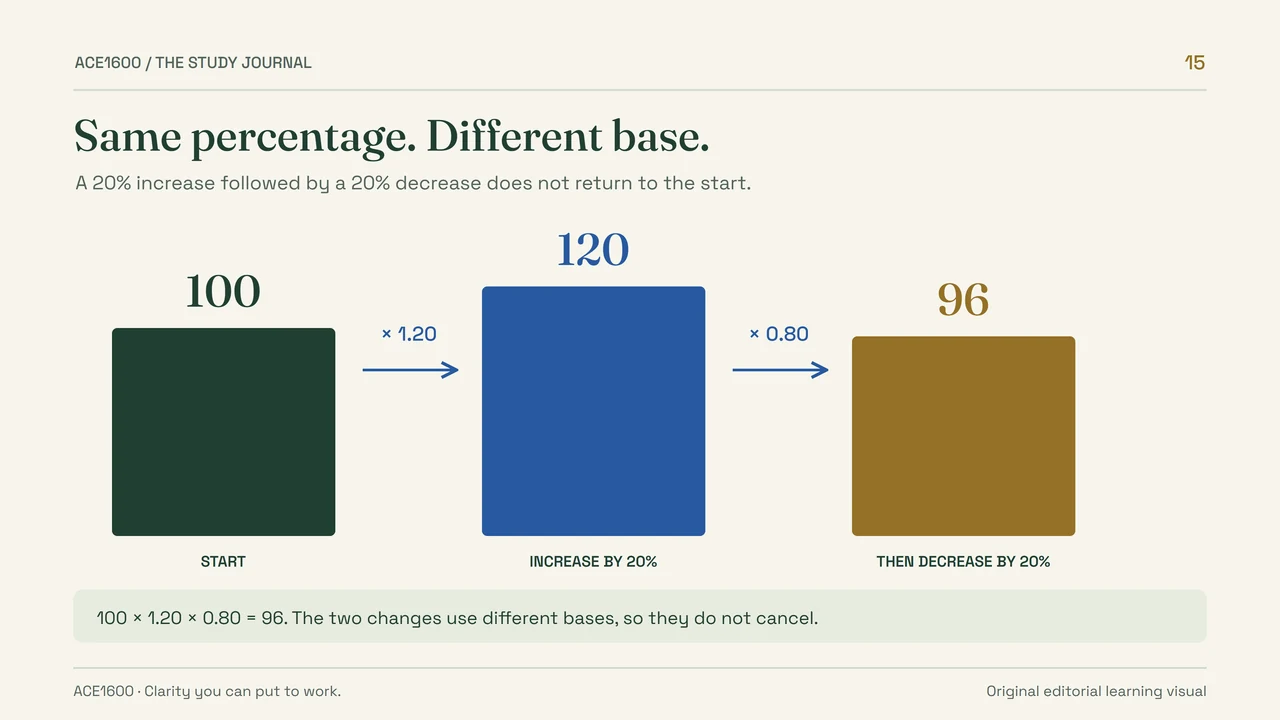
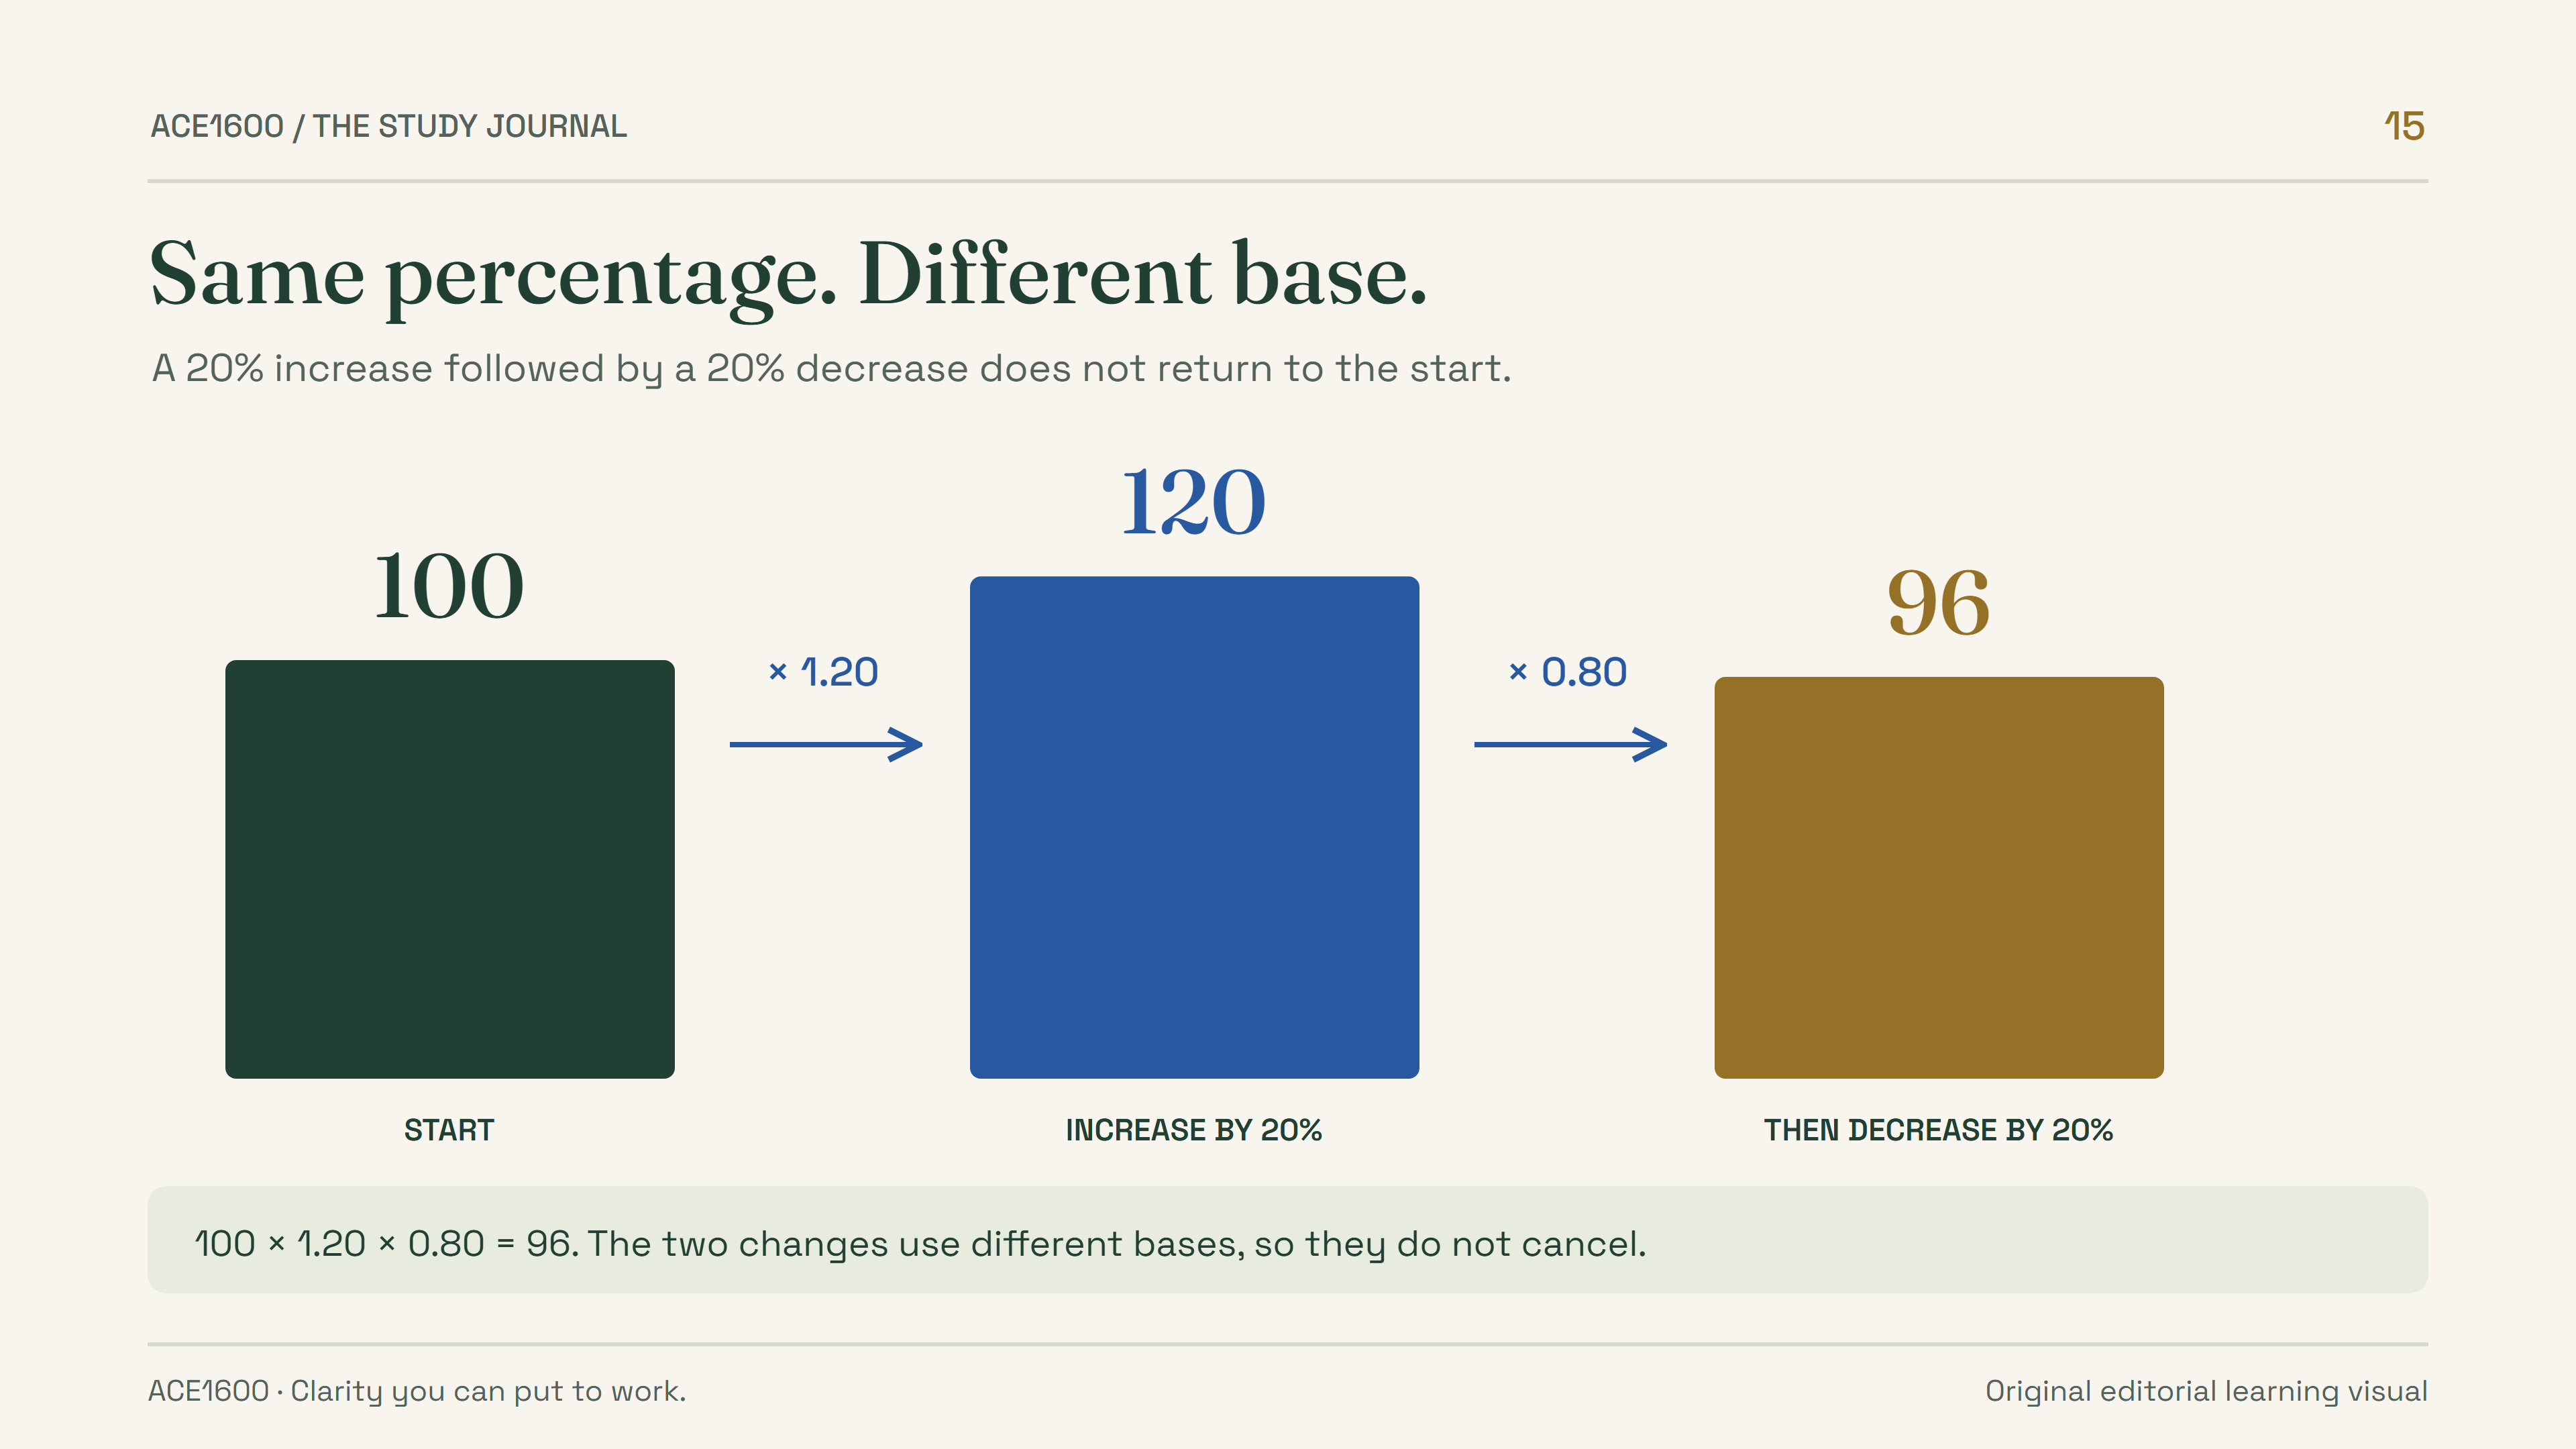
- Original example: begin with 100.
- A 20% increase gives 100 × 1.20 = 120.
- A subsequent 20% decrease uses 120 as the base: 120 × 0.80 = 96.
- The final amount is 4% below the starting amount; opposite percentage changes do not cancel.
1. Name the whole before finding the part
“Thirty percent of the students” is incomplete until you know which students are included. The whole might be the school, a grade, the students surveyed, or only those who selected a particular activity. Put that group into words before writing a fraction. This habit is particularly valuable in two-way tables.
Original example: a club survey
A school has 240 students in a grade. Of these, 90 join at least one club. The percentage of the grade joining a club is 90/240 × 100 = 37.5%.
If 36 of the club participants join the science club, then 36/90 × 100 = 40% of club participants join science. But 36/240 × 100 = 15% of the entire grade join science.
The count 36 is unchanged. The two percentages differ because the comparison group changes. Neither percentage is meaningful without its base.
Translate “p percent of B” into (p/100)B. If you know the part and need the whole, solve that relationship rather than guessing which operation feels familiar. For example, if 42 is 35% of a number, write 0.35B = 42. Dividing gives B = 120, and 35% of 120 returns 42.
Keep percent notation separate from decimal notation. A rate of 6% is 0.06 as a multiplier, while 0.6 represents 60%. Writing the conversion explicitly is worthwhile when small decimals or several quantities are involved. A quick estimate can catch a factor-of-ten mistake before it reaches the final answer.
For every percentage result, finish the sentence: “This is ___ percent of ___.” If the second blank is unclear, revisit the setup. The purpose of the sentence is to preserve the meaning that can disappear inside a calculator entry.
2. Separate numerical change from percent change
The numerical change is new amount minus original amount. The percent change compares that difference with the original amount: (new − original)/original × 100%. A positive result indicates an increase, and a negative result indicates a decrease when the starting amount is positive.
| Quantity | Example: 80 becomes 100 | Meaning |
|---|---|---|
| Numerical increase | 100 − 80 = 20 | The amount rose by 20 units. |
| Percent increase | 20/80 × 100 = 25% | The increase is one quarter of the original amount. |
| New amount as a percent of original | 100/80 × 100 = 125% | The final amount includes the original 100% plus the increase. |
Be careful with phrases such as “reduced by” and “reduced to.” Reducing a positive value by 25% leaves 75% of the original. Reducing it to 25% of the original leaves one quarter of the original—a 75% decrease. The same number describes different relationships because “by” names the change and “to” names the final amount.
Original example: recover the starting value
After a 15% increase, a monthly membership costs $69. Let the original cost be c. The new cost is 1.15c, so 1.15c = 69 and c = 60.
Subtracting 15% of 69 would use the final amount as the base and give $58.65. That is not the original price because the increase was 15% of the original $60.
Check: 15% of 60 is 9, and 60 + 9 = 69. The check restores the story as well as verifying the arithmetic.
When the problem asks for a percent decrease, you can state the magnitude as a positive percentage with the word “decrease.” Going from 100 to 80 is a 20% decrease. Going back from 80 to 100 is a 25% increase because the original amount for the return trip is now 80.
3. Multiply successive changes instead of canceling them
Each percentage change uses the amount present at that step. A 20% increase followed by a 20% decrease does not return to the starting value because the decrease applies to a larger base. Multipliers make this visible without a long sequence of separate calculations.
Why +20% and −20% do not cancel
- Start100
The original amount is the first base.
- Increase by 20%120
Multiply 100 by 1.20.
- Decrease by 20%96
Multiply the new base, 120, by 0.80.
- Overall change4% decrease
The final amount is 96% of the starting amount.
The combined multiplier is 1.20 × 0.80 = 0.96. This method also works when the starting number is unknown: if the original amount is P, the final amount is 0.96P. The calculation describes the relationship without choosing an arbitrary starting value.
Original example: a discount and a fee
A ticket priced at $150 receives a 10% discount, followed by a 5% service fee on the discounted price. Its final cost is 150 × 0.90 × 1.05 = $141.75.
The net multiplier is 0.945, so the final price is 94.5% of the original, a 5.5% decrease. Subtracting 10% and adding 5% would incorrectly predict a 5% decrease.
Read the fee condition carefully. If the fee were instead 5% of the original price, the calculation would be 135 + 7.50 = $142.50. The wording determines the base.
Repeated equal percentage growth can be represented by an exponent. An amount P growing by 8% per period becomes P(1.08)^n after n periods, assuming that the same proportional rule applies each time. College Board includes exponential relationships within Advanced Math. [2] Keep the period attached to n: months, years, or another stated interval.
4. Distinguish percentage points from relative change
When the values being compared are already percentages, two different measures may be useful. Percentage-point change is simple subtraction between the percentages. Relative percent change divides that difference by the original percentage. They answer different questions and should not be used interchangeably.
Original example: participation rises
A program’s participation rate rises from 40% to 50%. The increase is 10 percentage points because 50 − 40 = 10.
Relative to the original rate, the increase is (50 − 40)/40 × 100 = 25%. Thus “10 percentage points” and “25% relative increase” both describe the same change.
If the total eligible population also changed, the number of participants would require an additional calculation. A change in rate alone does not tell you the change in count.
Two valid comparisons, different meanings
- Percentage-point change10 points
Subtract the two rates: 50 − 40.
- Relative percent change25% increase
Compare the difference with the original rate: 10/40.
- Change in countMore information needed
You also need the population size for each rate.
This distinction helps when evaluating a headline or answer choice. A statement may use a dramatic relative percentage while the absolute change is small, or use a small percentage-point difference while the relative change is substantial. Neither format is automatically misleading, but the wording must match the calculation and context.
Try a second pair: a rate falls from 12% to 9%. That is a decrease of 3 percentage points and a relative decrease of 3/12 = 25%. The denominator remains the original rate, even though both values already contain percent signs.
5. Read the condition before dividing a table
A two-way table organizes counts by two characteristics. The phrase “among students who…” usually narrows the group you should use as the denominator. Before calculating, identify the relevant row, column, or total. Do not let the largest number in the table become the denominator automatically.
| Group | Morning | Evening | Total |
|---|---|---|---|
| Sports club | 18 | 42 | 60 |
| Arts club | 24 | 16 | 40 |
| Total | 42 | 58 | 100 |
Among sports-club students, the proportion preferring evening is 42/60 = 70%. Among students preferring evening, the proportion in the sports club is 42/58, or about 72.4%. The numerator is the same, but the condition chooses a different denominator.
The proportion of all surveyed students who are in the sports club and prefer evening is 42/100 = 42%. Notice the difference between “and” and “among.” The first combines two characteristics within the full sample; the second restricts the sample before calculating.
Original practice: find the right denominator
Using the table, what percentage of arts-club students prefer morning? The relevant group is the 40 arts-club students, and 24 of them prefer morning. The answer is 24/40 × 100 = 60%.
What percentage of morning-preferring students belong to the arts club? Now the relevant group is the 42 morning-preferring students. The answer is 24/42 × 100, approximately 57.1%.
Write a one-sentence interpretation beside each calculation. If the sentences sound identical, you have probably lost the condition.
For further official practice, the Student Question Bank offers topic filters. [3] Choose a small set involving percentages or conditional probability and explain the denominator for every item before doing the arithmetic.
6. Use counts when combining averages
An average summarizes a total divided by a count. To combine groups of different sizes, recover each total first. Simply averaging the group averages gives each group equal weight, which is appropriate only when their counts are equal.
Original example: two classes, different sizes
A class of 12 students has an average project score of 80. Another class of 18 students has an average of 90. Their score totals are 12 × 80 = 960 and 18 × 90 = 1620.
The combined total is 2580 across 30 students, so the overall mean is 2580/30 = 86. Averaging 80 and 90 would give 85 and ignore that more students are in the higher-scoring group.
A useful check is that 86 lies between 80 and 90 and is closer to 90 because that group is larger.
The same principle applies to rates. If two groups have different response rates, the overall rate depends on how many people were in each group. You cannot reliably combine percentages without knowing the relevant bases. Ask for the underlying counts whenever a problem gives several summaries.
Keep mean and median separate. The mean uses every numerical value through the total; the median depends on the ordered middle. Adding an extreme value can move the mean substantially while leaving the median much less affected. A problem about one measure cannot be answered by silently substituting the other.
For the list 2, 3, 4, 5, 26, the mean is 40/5 = 8 and the median is 4. Both are correct summaries, but they tell different stories about the distribution. Read which statistic the question requests and consider whether an outlying value is relevant.
7. Check what the data can actually support
A calculation may be exact while the conclusion built on it is too strong. If a voluntary survey finds that most respondents prefer an option, that does not automatically establish the preference of every student in a school. If two variables move together, that alone does not prove that one caused the other.
Original example: an association with another possible explanation
A school observes that students who attend an optional study group have higher average practice scores. The observation is consistent with the group helping, but it does not by itself isolate that effect.
Students who choose the group may differ in motivation, prior preparation, or time available. A conclusion that attendance alone caused the difference goes beyond the information described.
The careful response distinguishes the observed association from a causal claim. Ask how participants were selected and whether the study design supports the proposed inference.
When interpreting a graph, inspect axis labels, units, scales, and the population represented. A line connecting measured points does not automatically justify predictions far outside the observed range. A percentage from one sample is not a universal constant. The question may be testing those limits rather than difficult arithmetic.
If the underlying ideas need repair, Official SAT Prep on Khan Academy provides lessons and exercises. [4] Use a small sequence: name the quantity, choose the base, calculate, and explain the result. That explanation is the final check that your numbers answer the actual question.
For your next practice session, keep one prompt visible: “Compared with what?” Apply it to percentages, table conditions, averages, and conclusions. A clear comparison often does more to prevent errors than an extra page of formulas.
Sources & further reading
Rules and policies were checked on October 4, 2026. Follow the linked official pages for changes. Study plans and worked examples are A1600 editorial guidance.
- Problem-Solving and Data Analysis (opens in a new tab)College Board
- Advanced Math (opens in a new tab)College Board
- How to Use the Student Question Bank (opens in a new tab)College Board
- How to Use Khan Academy (opens in a new tab)College Board